


Summary:
A centralized monitoring and digital operations system for a municipal wastewater treatment plant, built on the Delta DIAView X SCADA platform—visualizing and controlling the entire process from influent to effluent across screens, CASS and biological tanks, disinfection and sludge units to keep effluent consistently compliant.
System Architecture
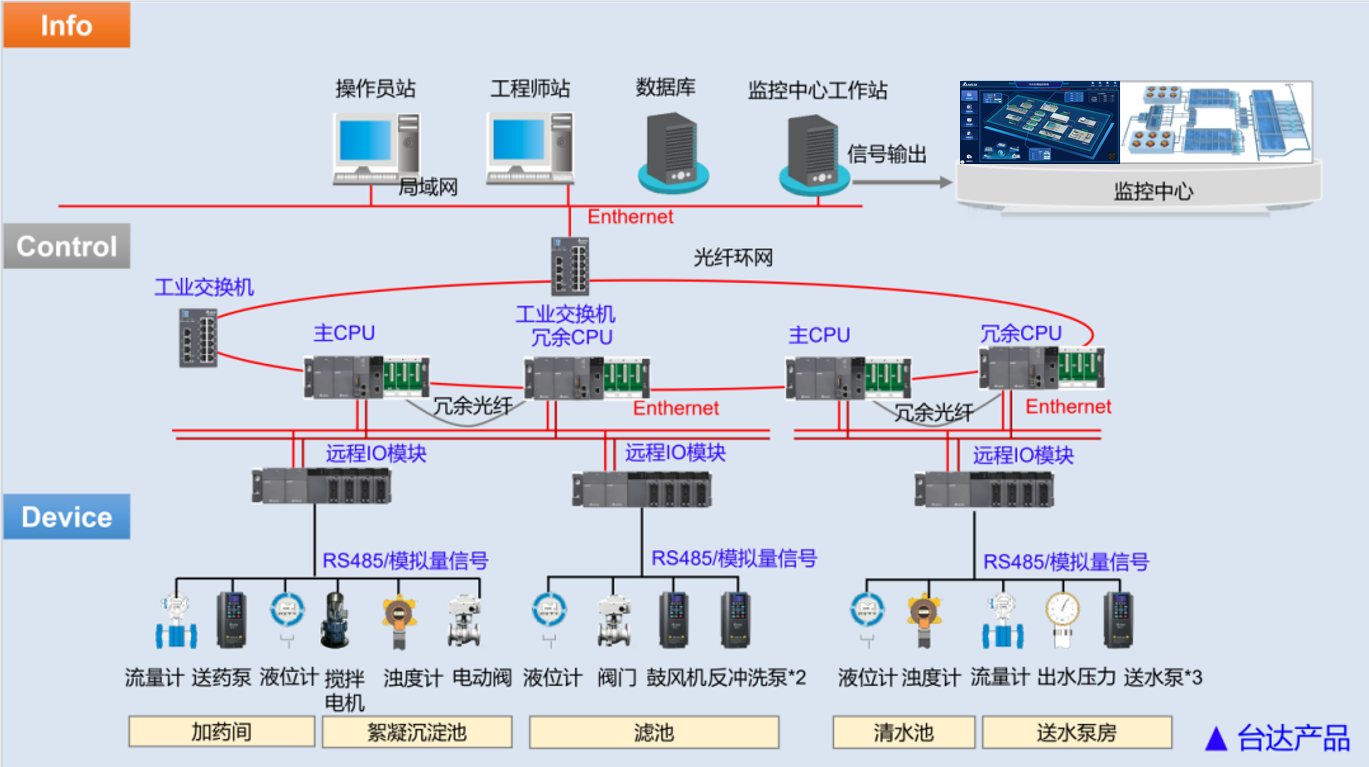
Key Functions
1. Plant Overview & 3D Process Simulation
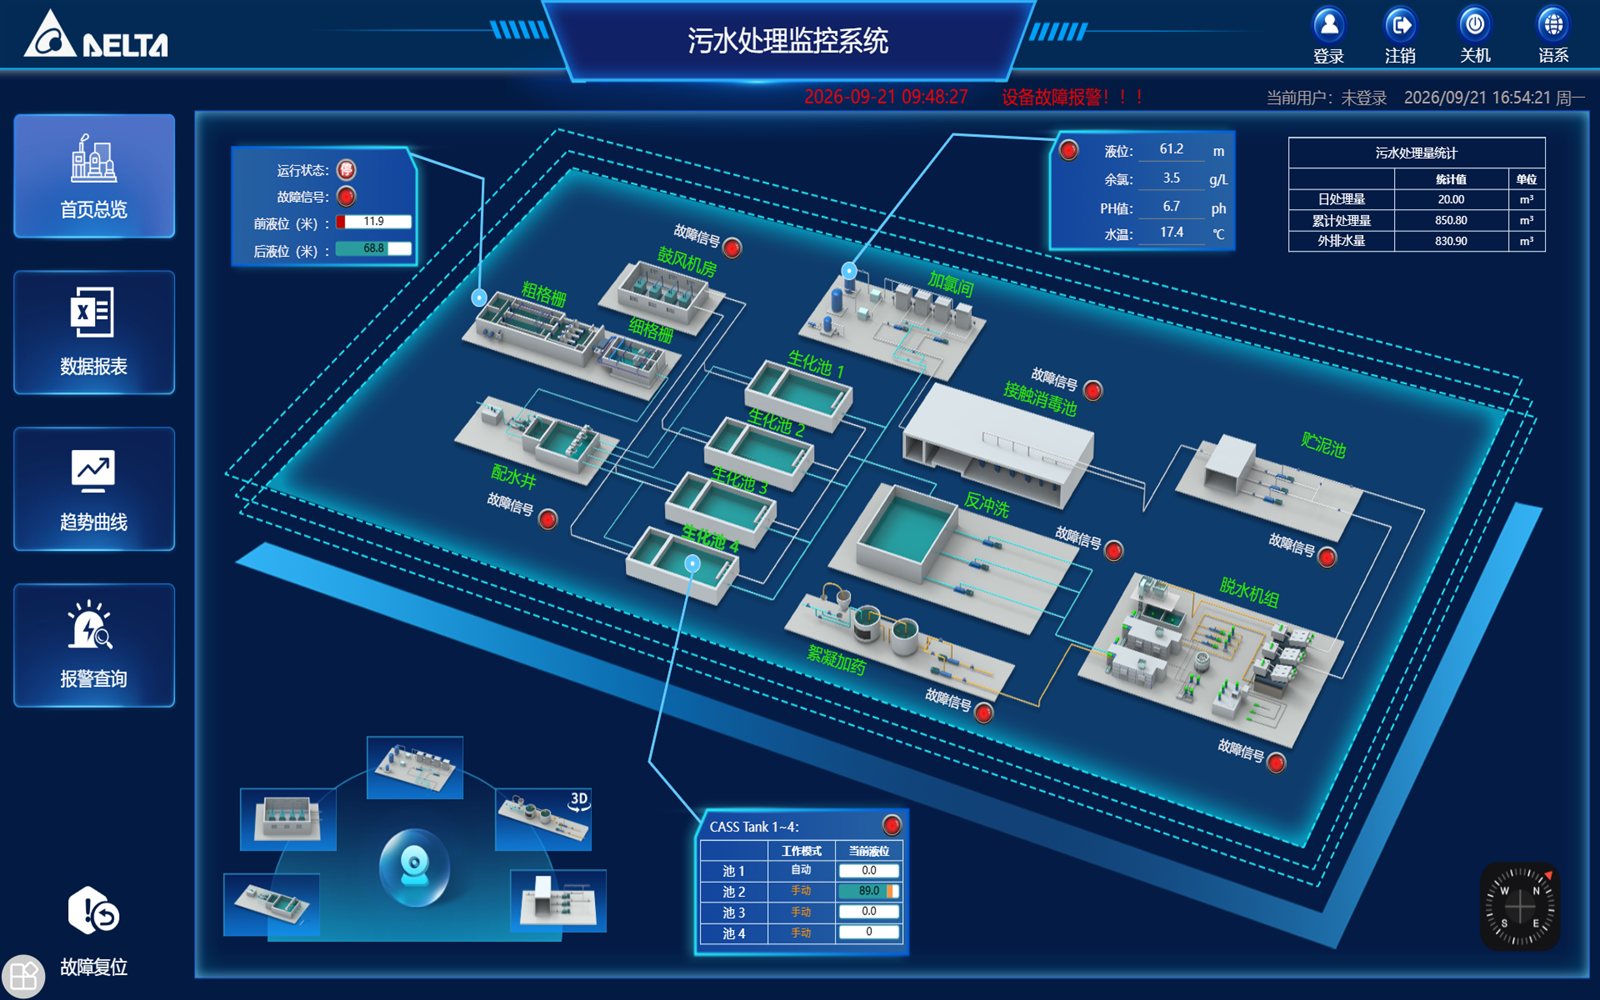
The home screen centers on the plant-wide process flow diagram, showing the operating status and real-time data of the coarse screen, fine screen, CASS tank, biological tank, contact disinfection tank, sludge storage and dewatering units.
3D process simulation models present key indicators of each structure in sync—internal level, residual chlorine, PH, water temperature, daily and cumulative throughput, and discharge volume—while the latest alarms scroll across the top of the page, helping operators grasp plant-wide conditions at a glance.
2. Flocculation Dosing & Sludge Storage Monitoring
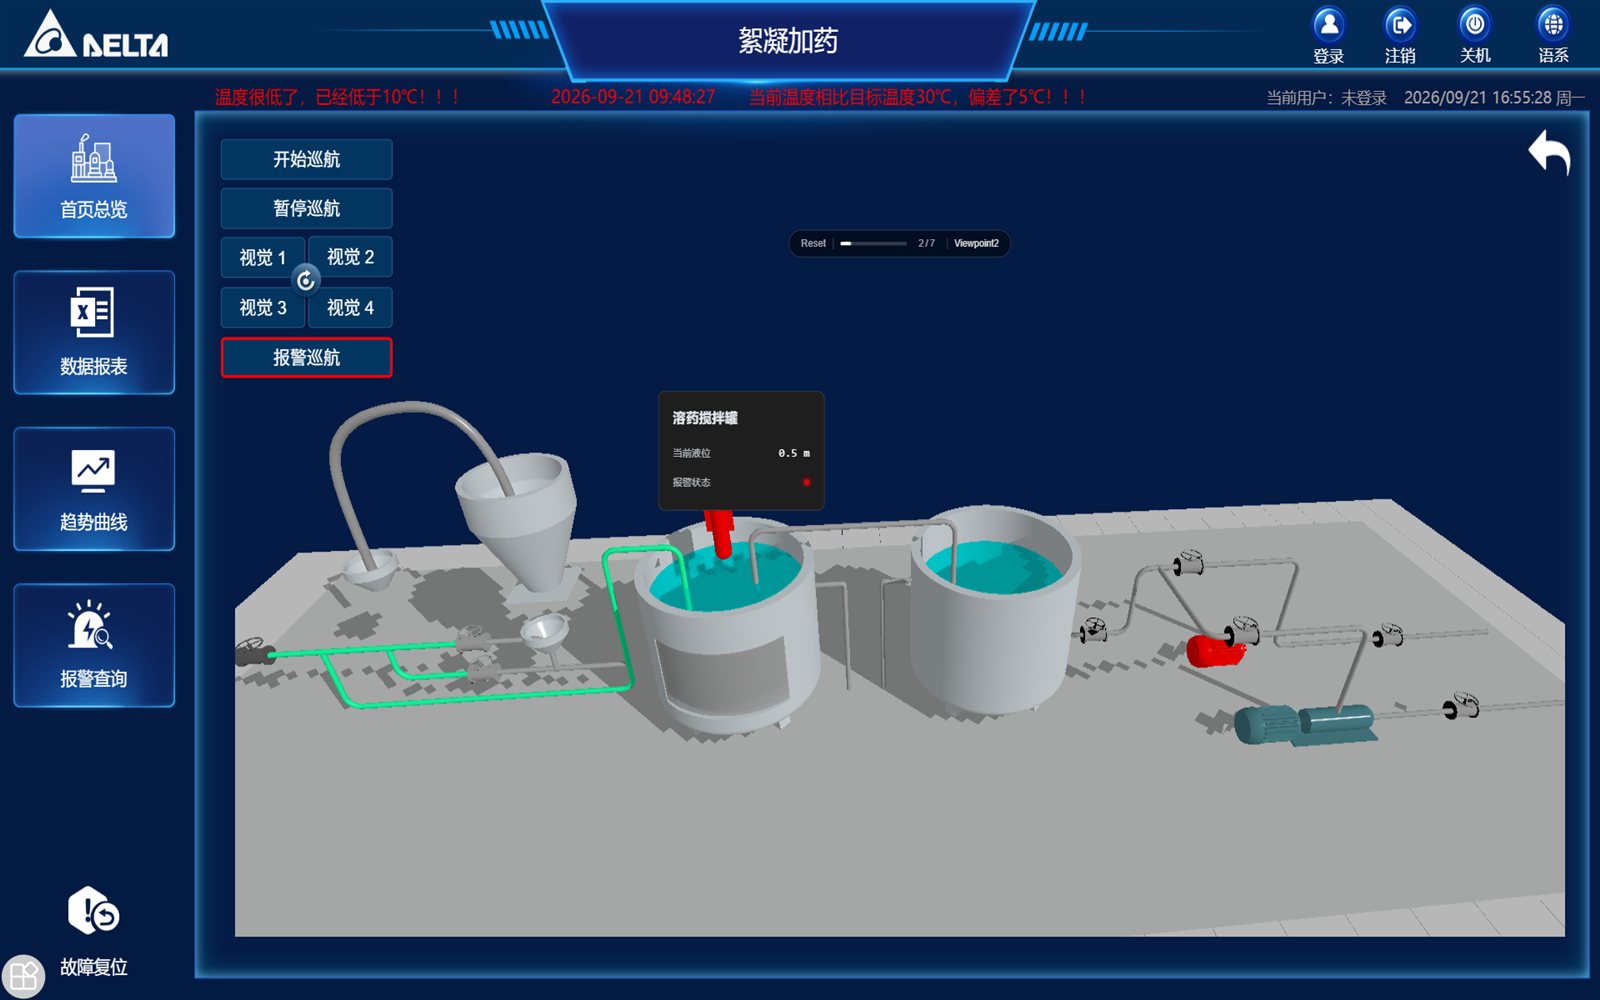
The flocculation dosing screen offers a 3D cruise view to monitor dosing-tank levels and dosing-pump start-stop status, with start, pause and alarm-cruise operations for fine-grained dosing control.
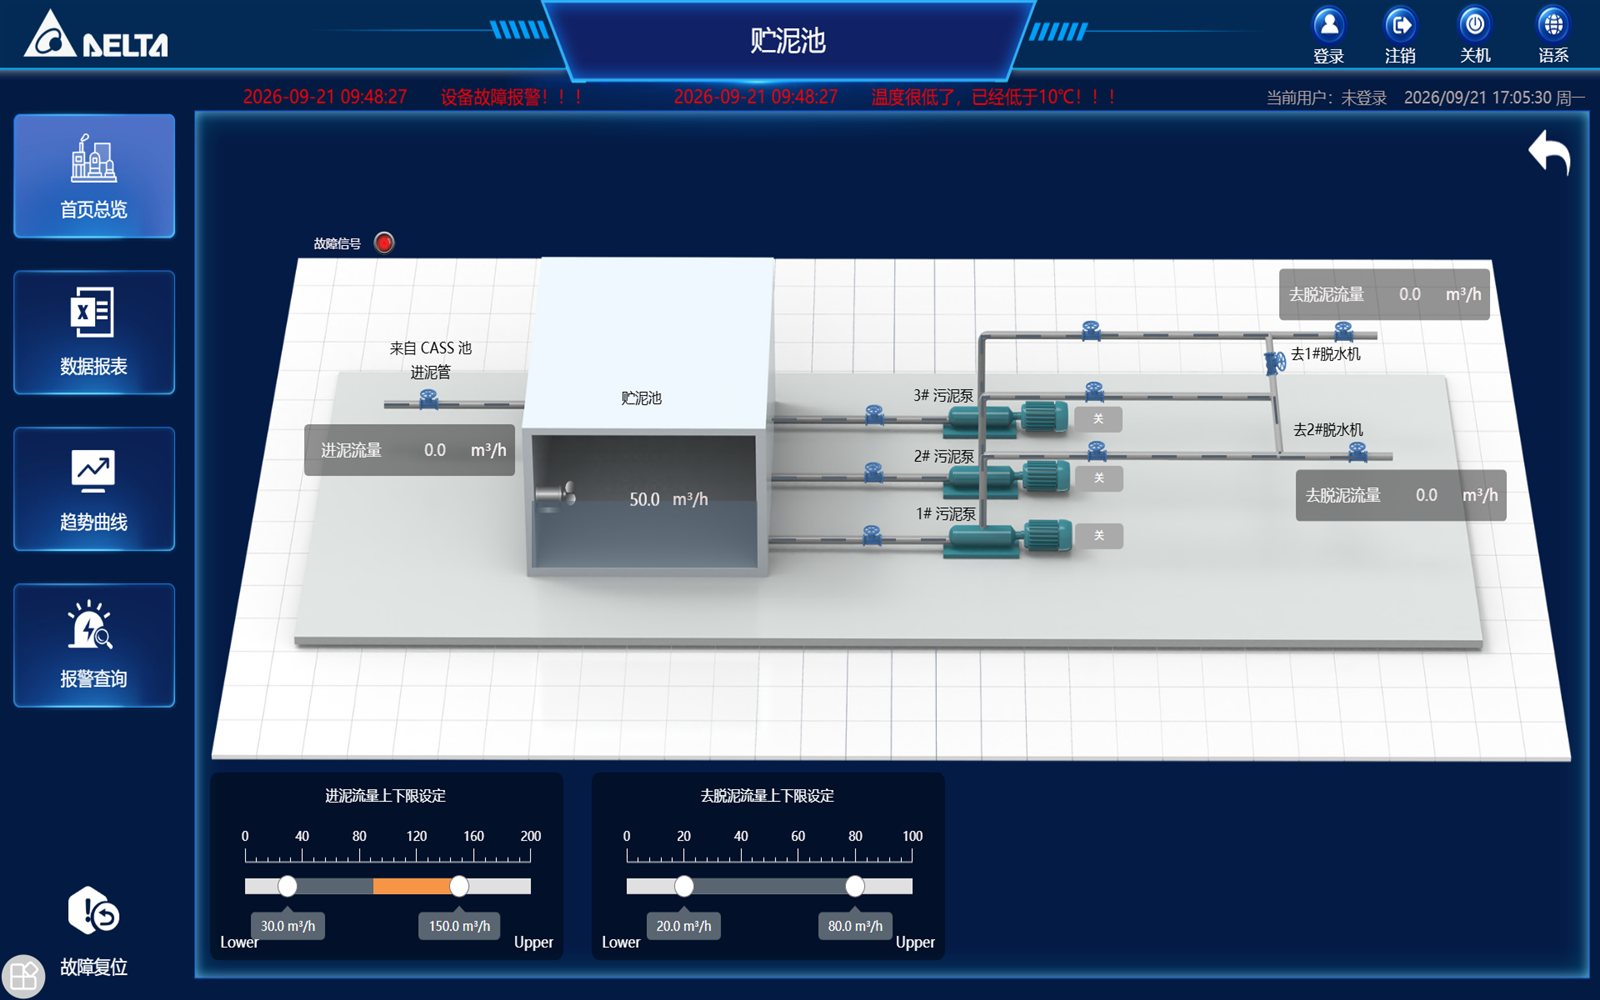
The sludge storage screen shows sludge inlet/discharge flow and the running status of sludge pumps No.1–No.3 in real time, with high/low limit settings to keep the sludge treatment stage running continuously and stably.
3. Reports & Statistical Analysis
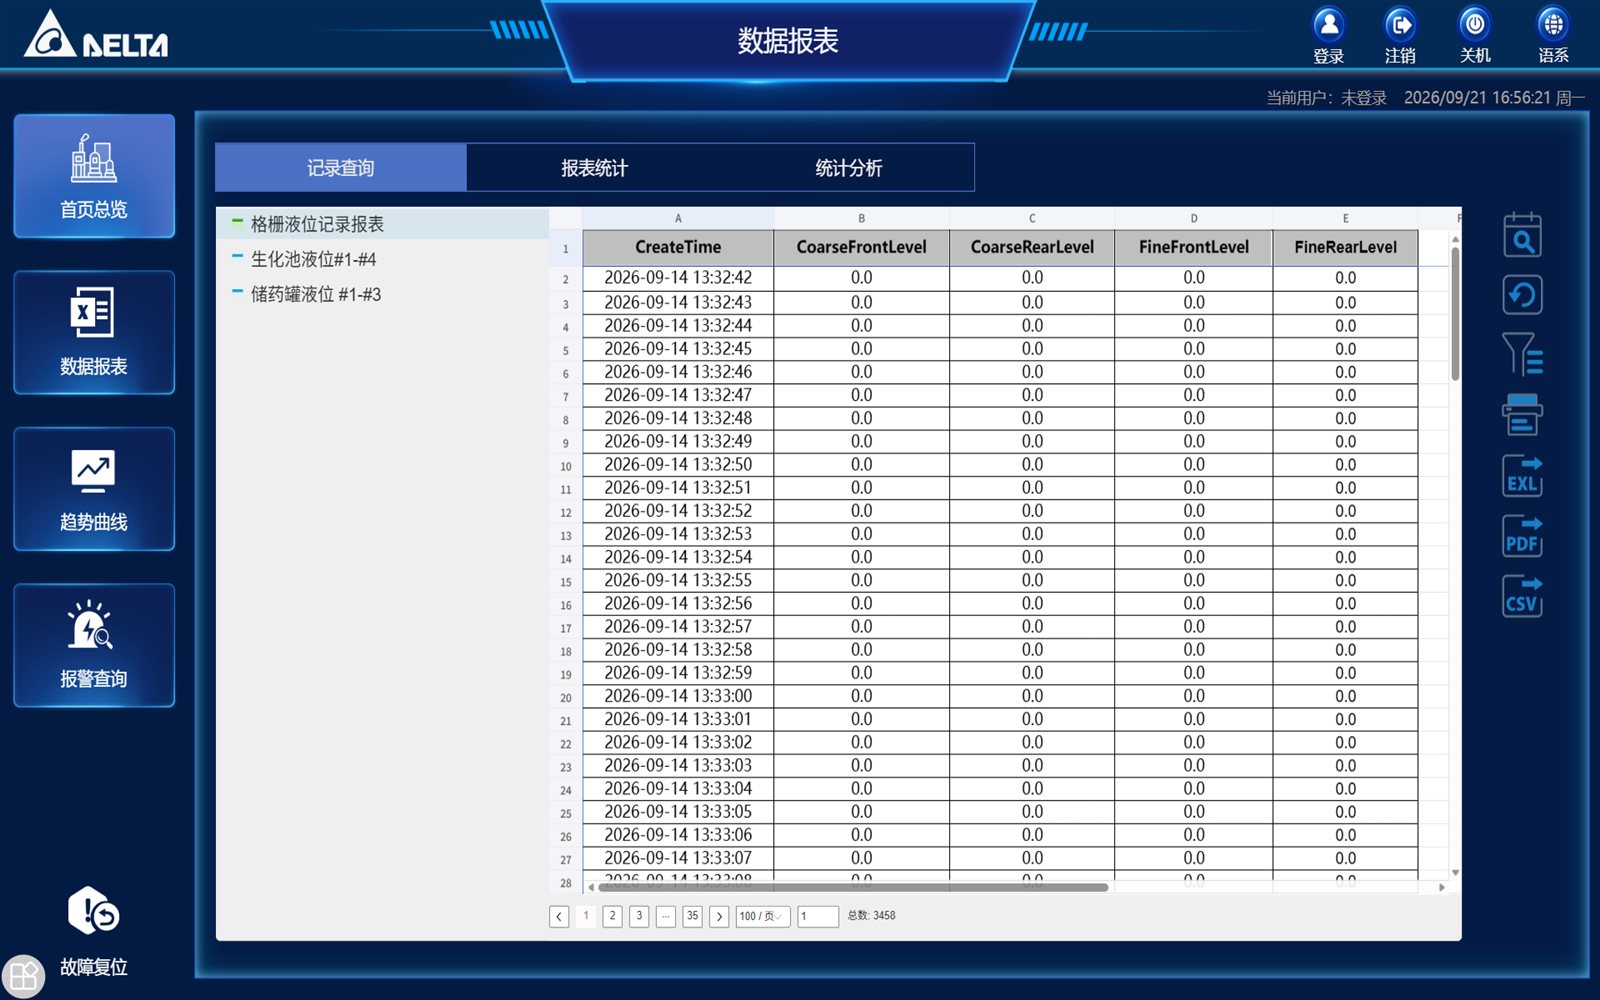
The record query module retrieves historical data such as screen level, biological tank level and chemical tank level by time range, providing solid evidence for process tracing and troubleshooting.
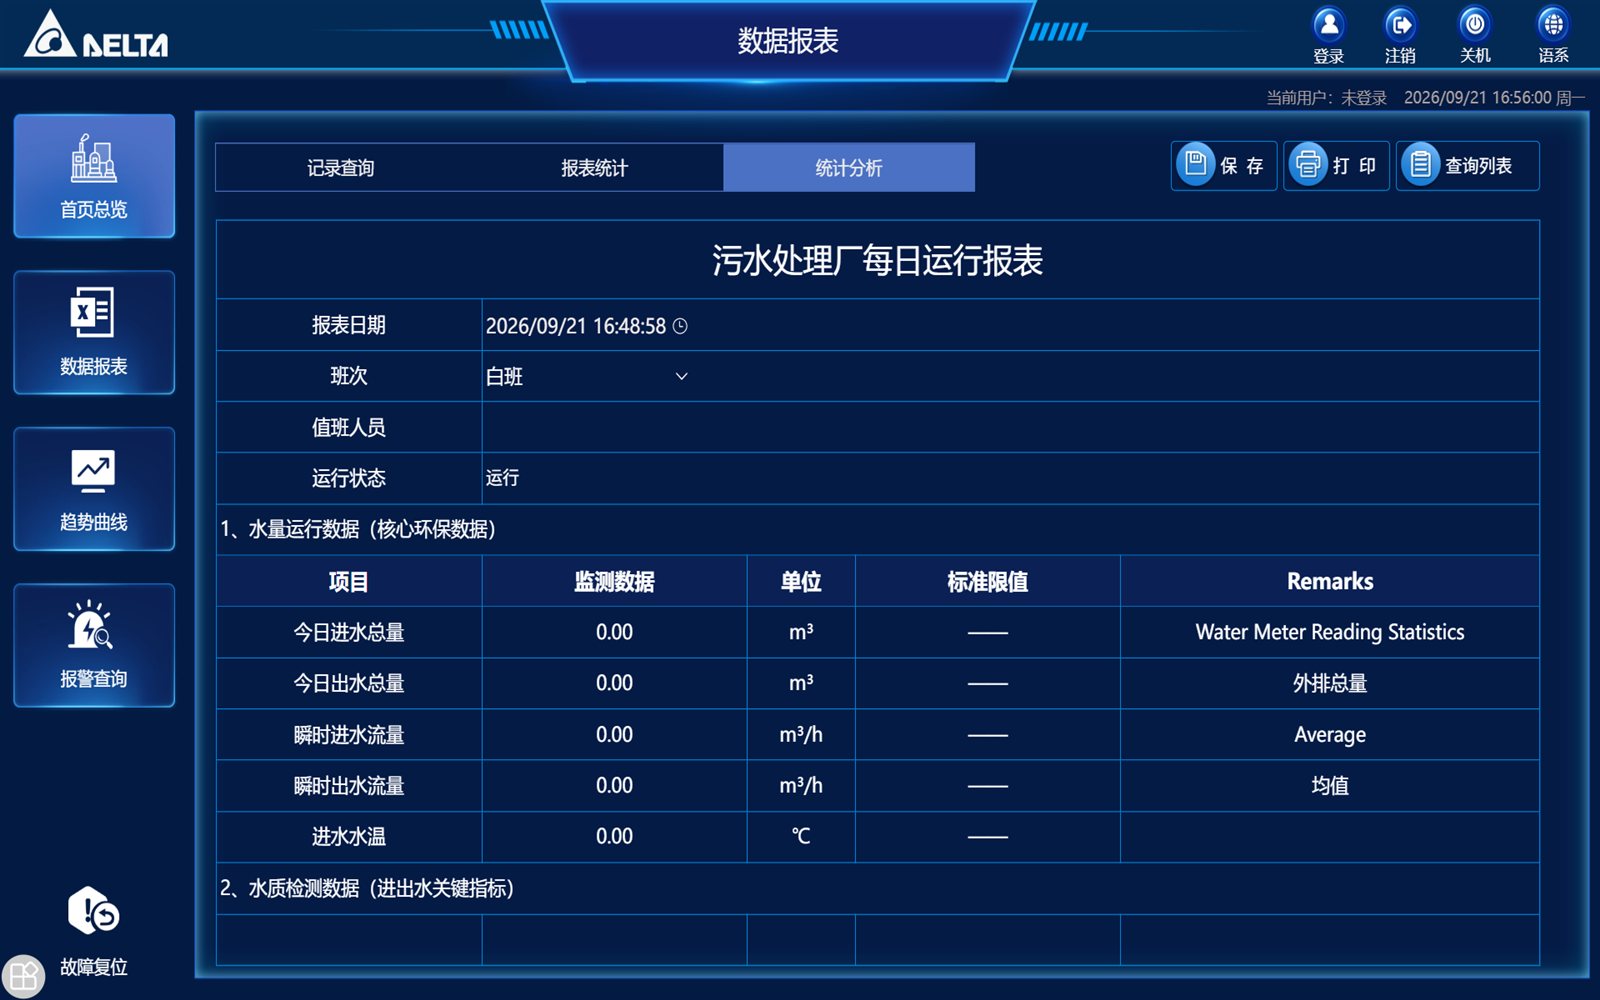
Daily operation reports are generated automatically, covering shifts, duty staff, total inflow/outflow and flow rates, water temperature and water quality tests—supporting daily review and shift-handover management.
4. Trend Curves
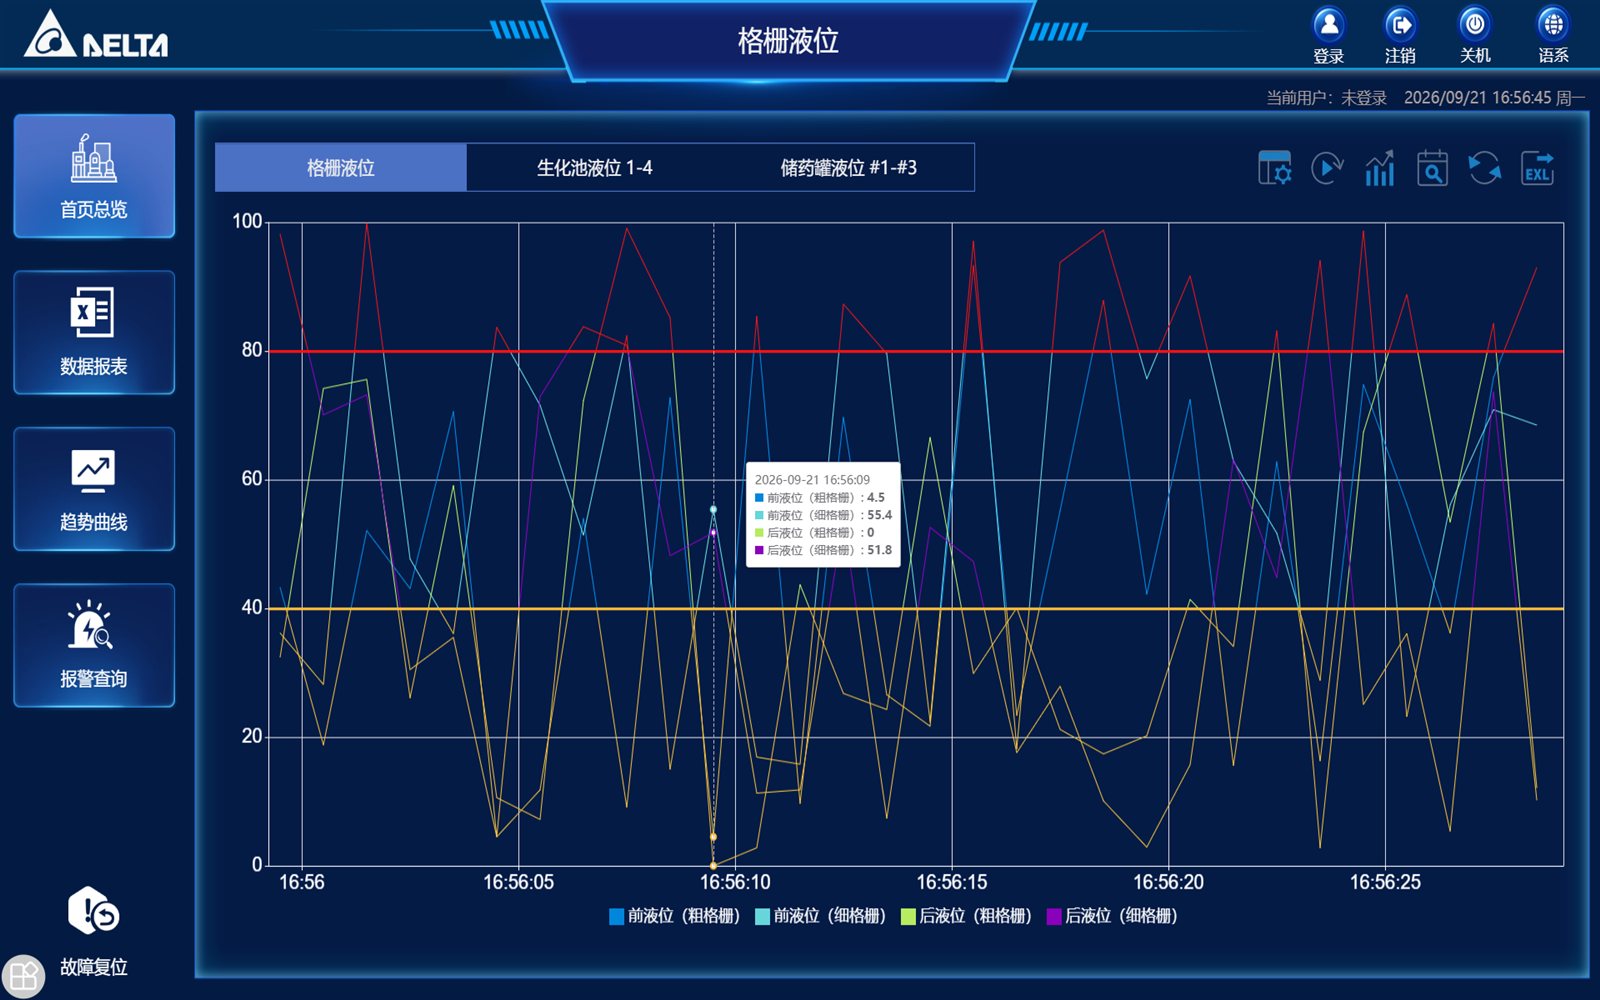
The trend module compares multi-channel level data on one screen; threshold lines, a time axis and hover value tips help operators see level patterns and process fluctuations intuitively.
5. Alarm Query
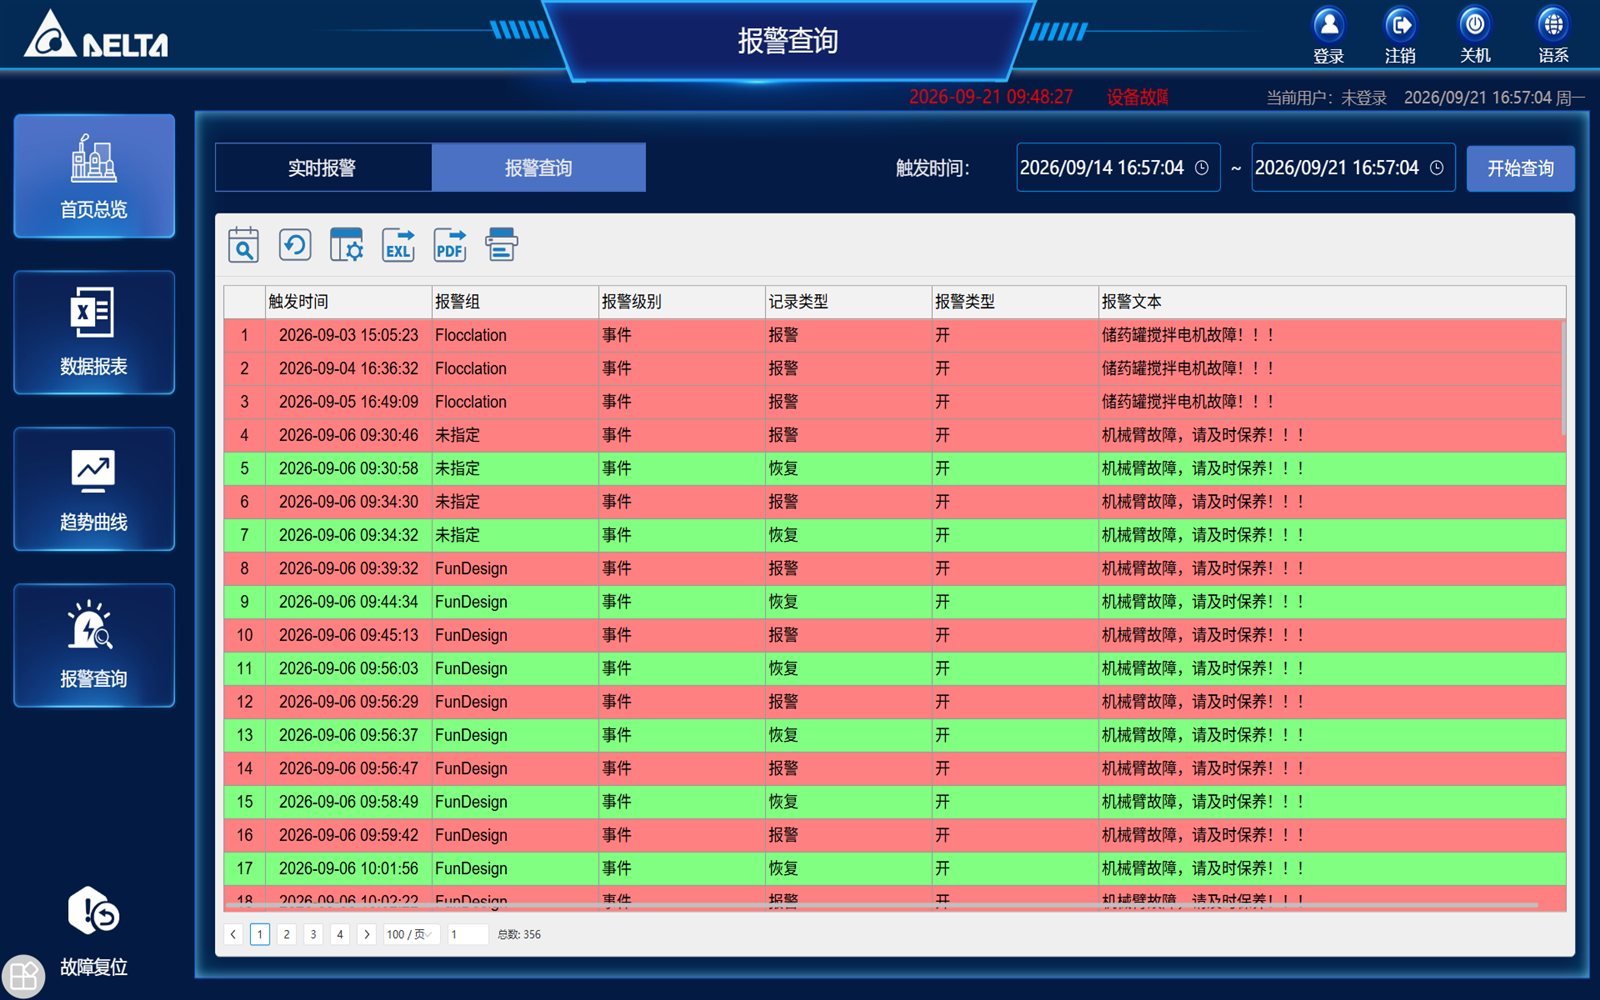
The alarm module provides a real-time alarm ticker and historical alarm search by time range, with export to Excel / PDF / CSV for record keeping and audit requirements.
Benefits
Influent, treatment and effluent covered end to end—key process sections and equipment status on one screen
Automatic daily reports and statistics provide a reliable basis for operations optimization and performance evaluation
Real-time alarm ticker plus historical search shortens fault discovery and handling
Closed-loop monitoring of level, water quality, dosing and sludge keeps effluent consistently compliant
